Admin track overview
Usage, health & logs
The Dashboard is your daily glance: instance health, key usage numbers, recent critical events, and how far along your setup is. When you want detail, three views go deeper.
- Token Usage — how many tokens each model is consuming against your plan's allowance, over time. This is where you catch a runaway prompt or a spike before billing does.
- Statistics — conversations, active users, Canvas artifacts and other product metrics.
- Logs — a searchable stream of requests and errors. Start here when a user reports "the copilot didn't answer."
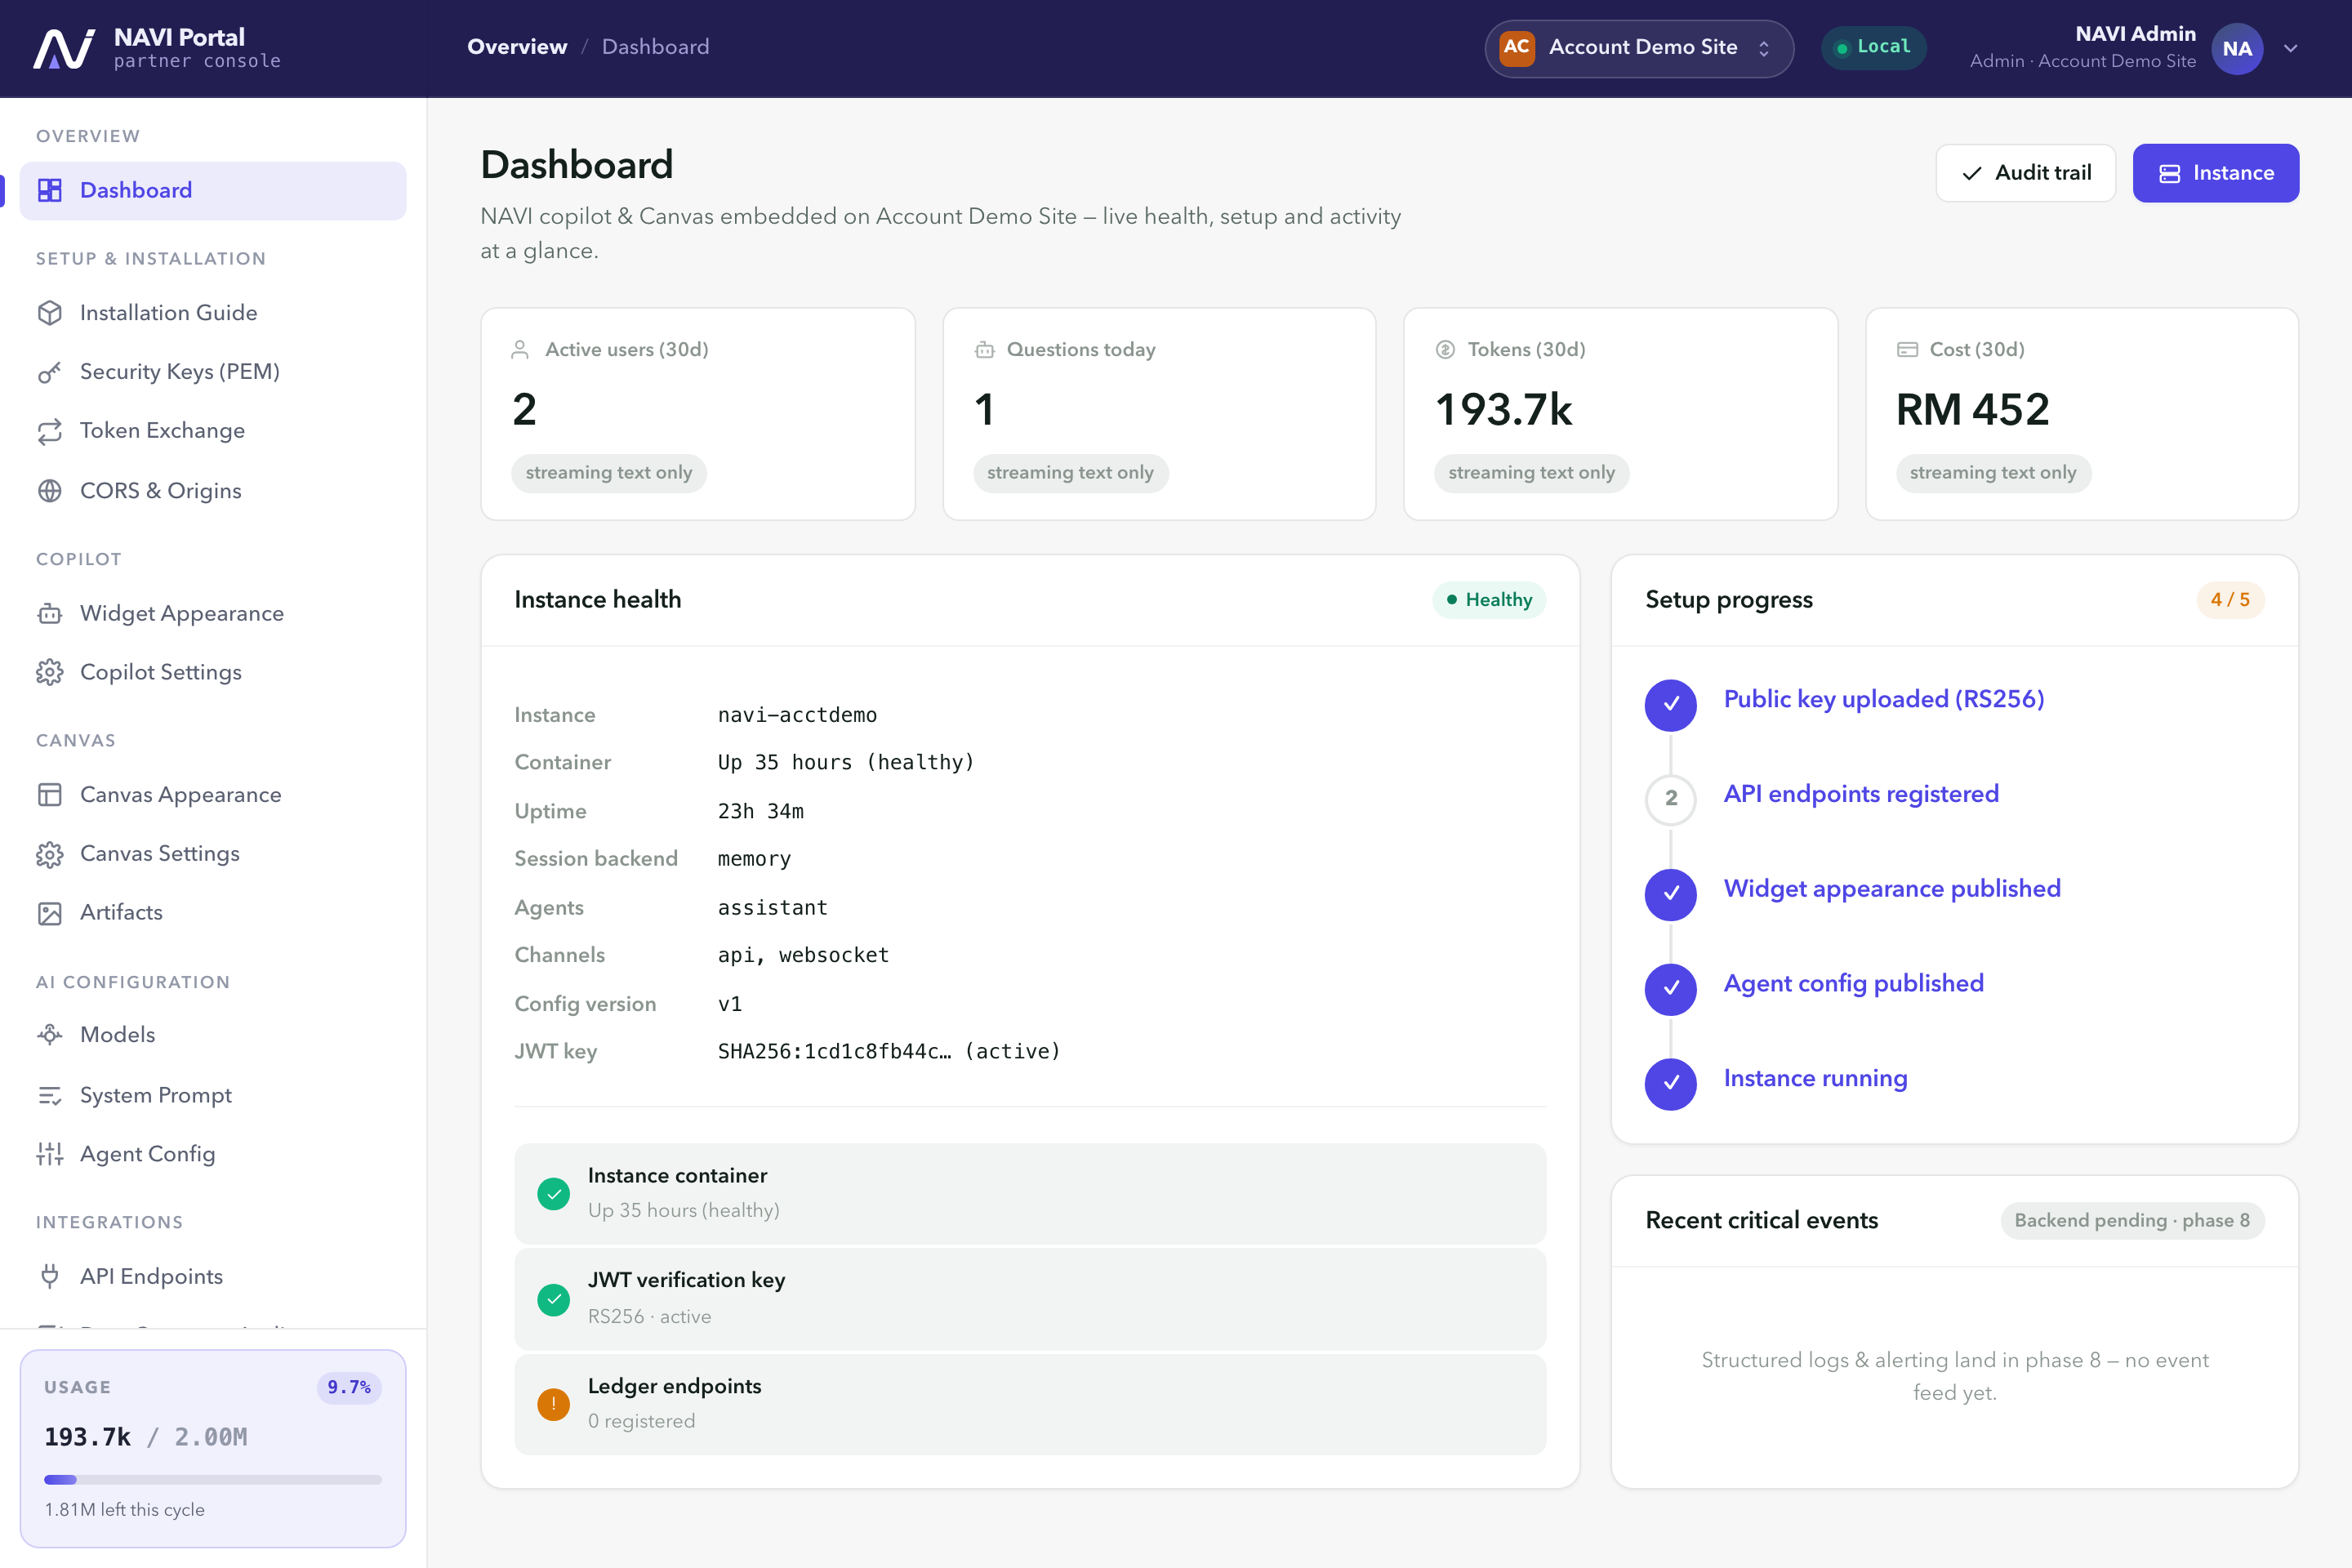 Dashboard. Health, KPIs and recent activity for your instance.
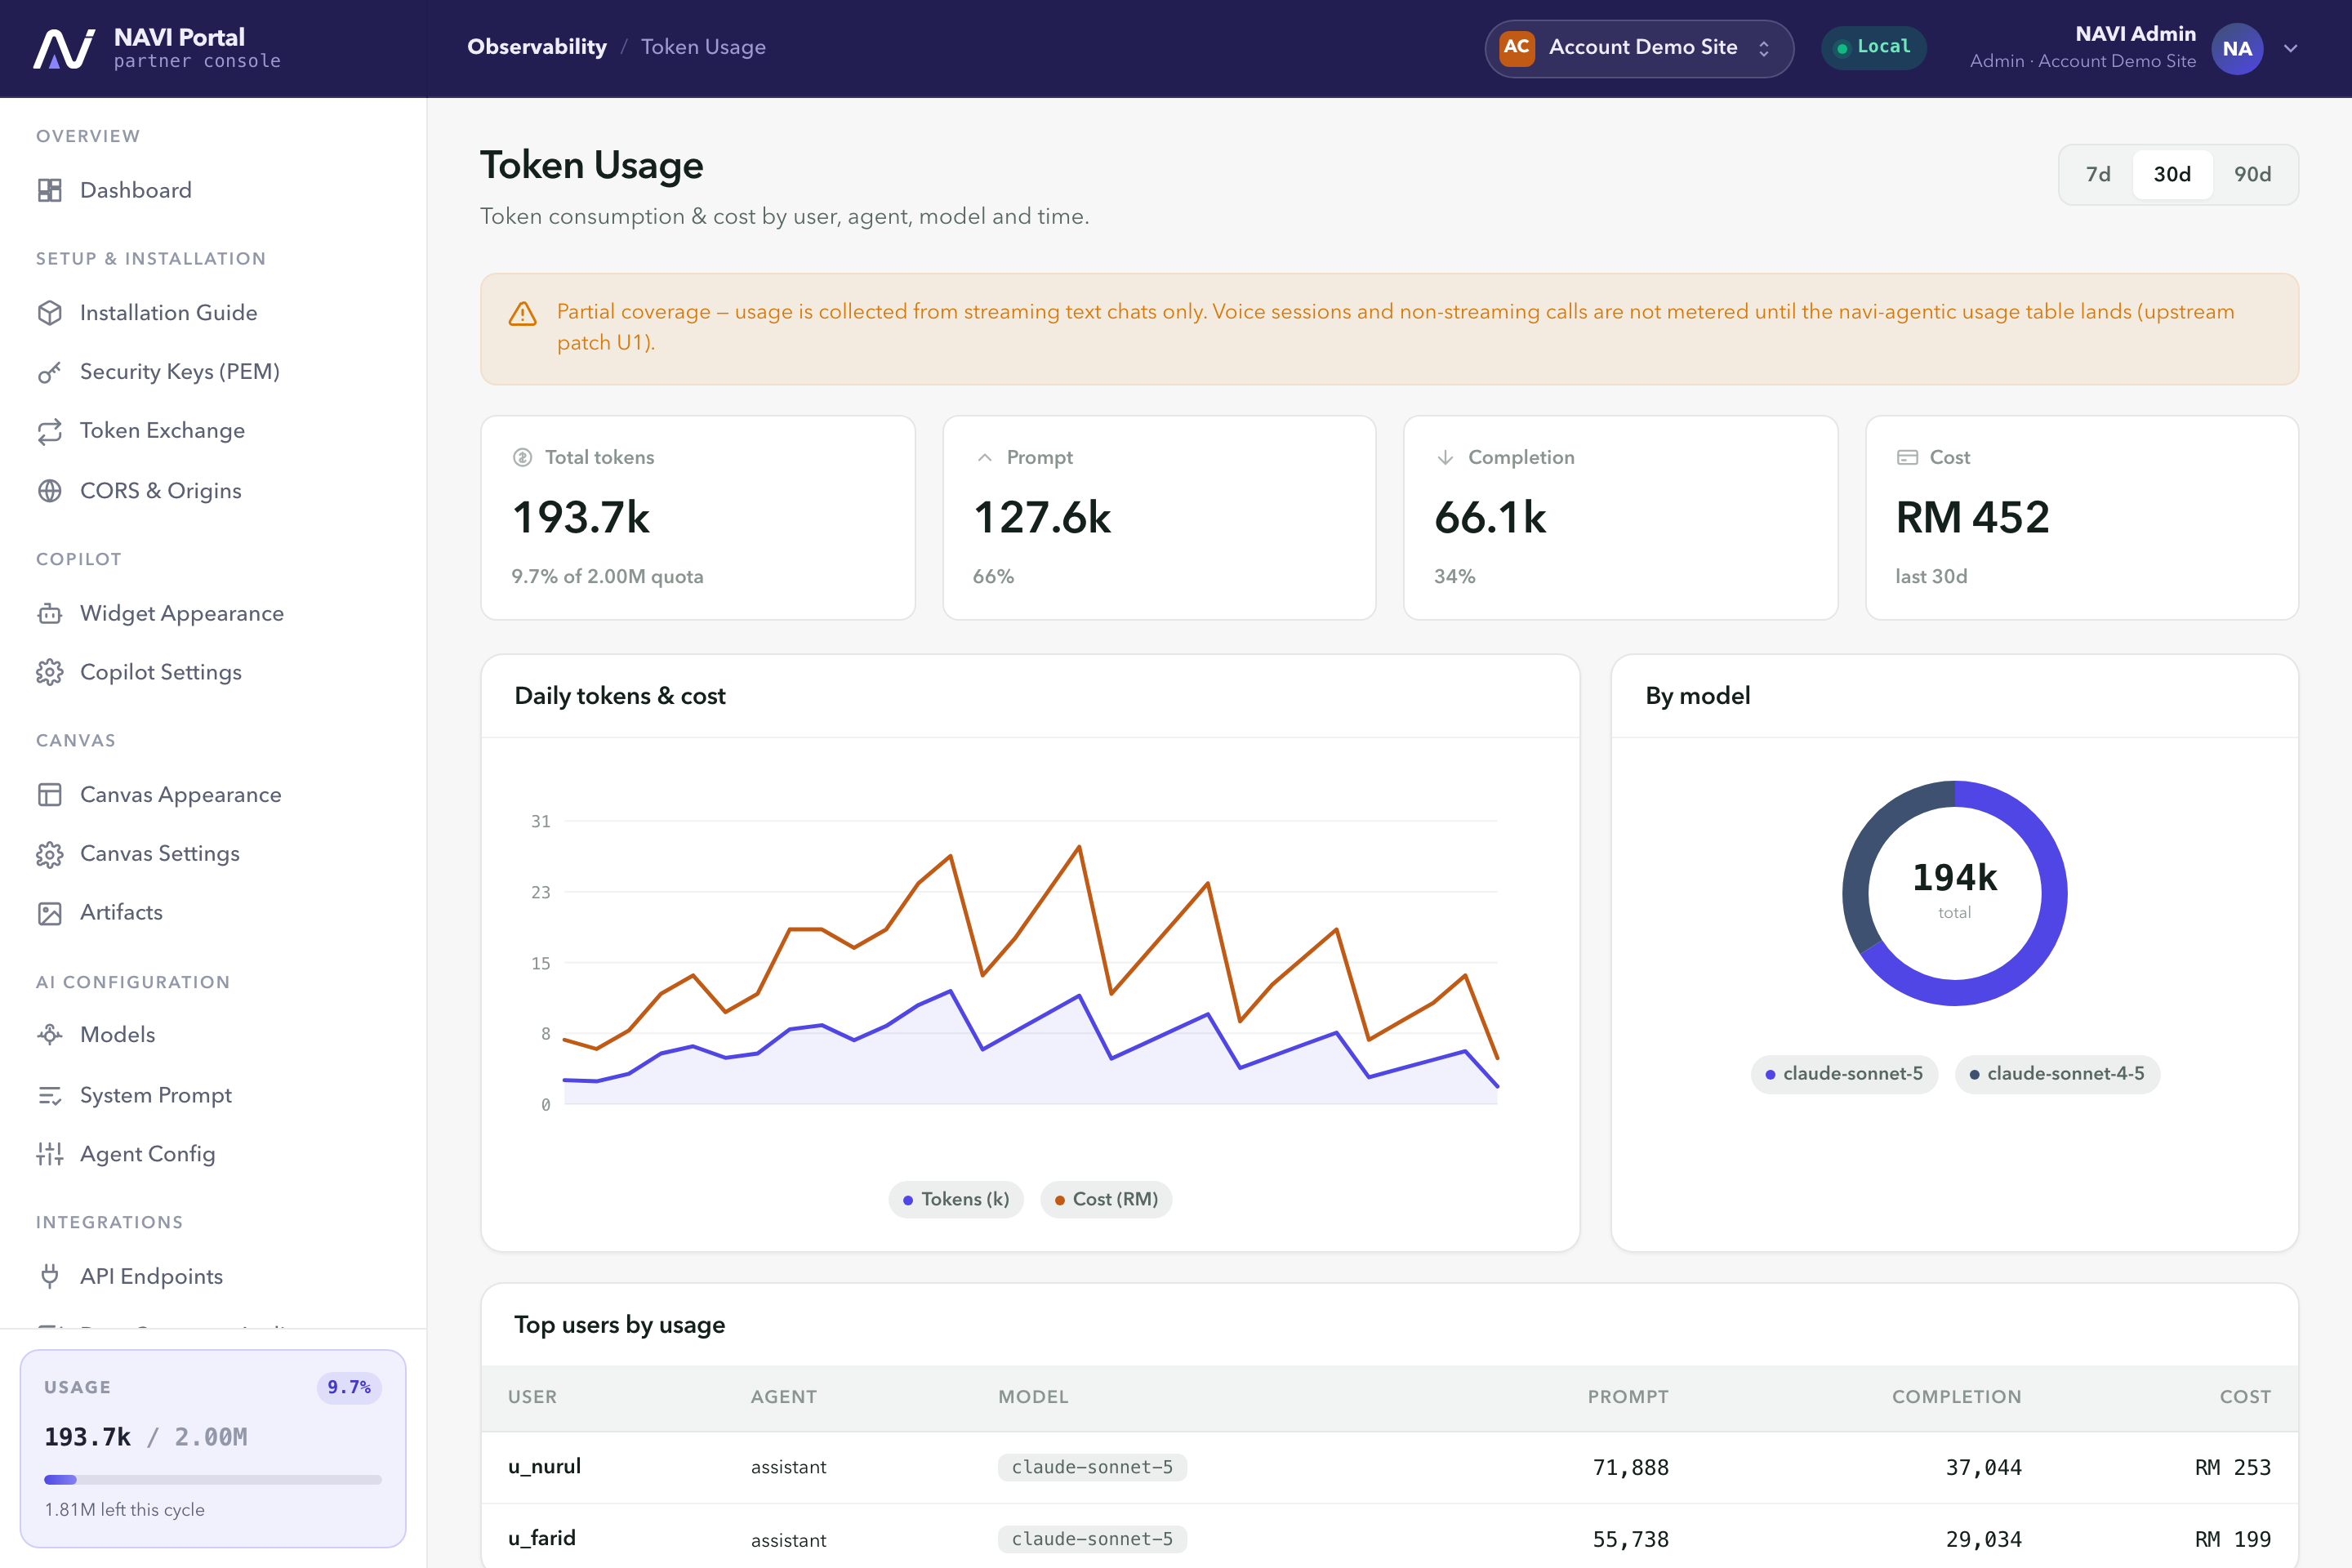 Token Usage. Consumption by model against your allowance.
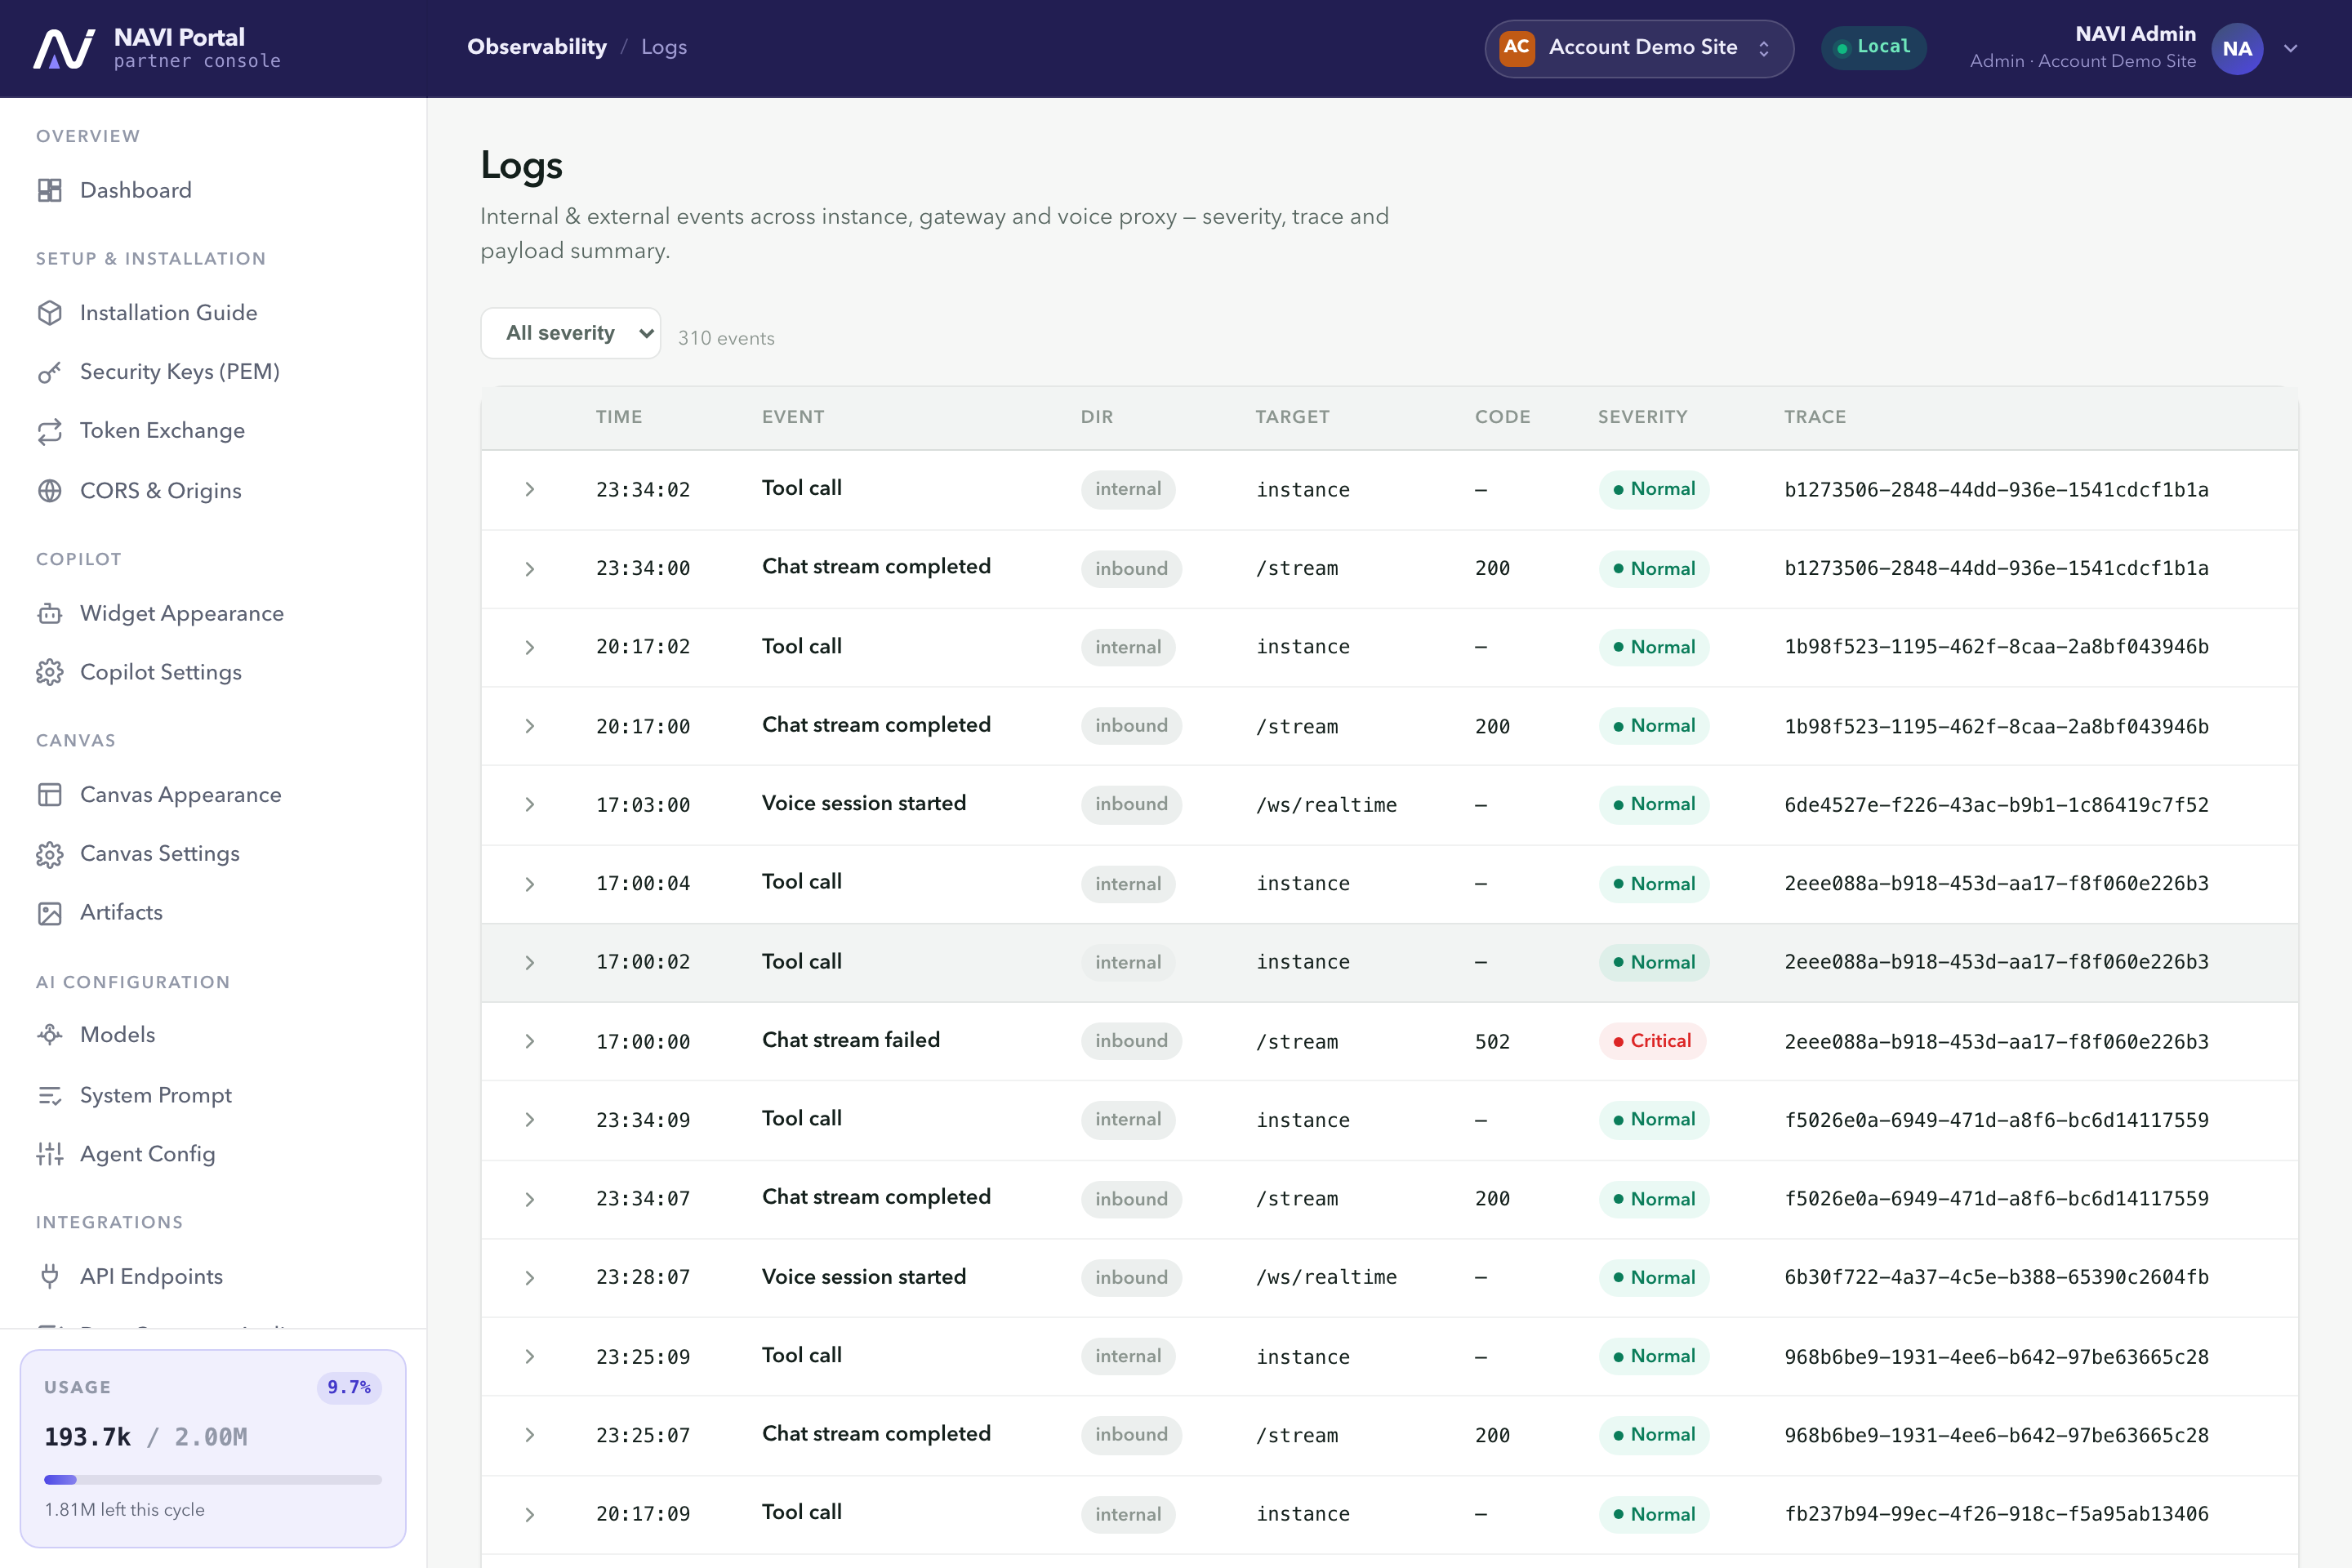 Logs. Search requests and errors when you're diagnosing a problem.